Inside Your Portal
What You Get
Curated video clips of winners, key points, technical issues, and tactical patterns
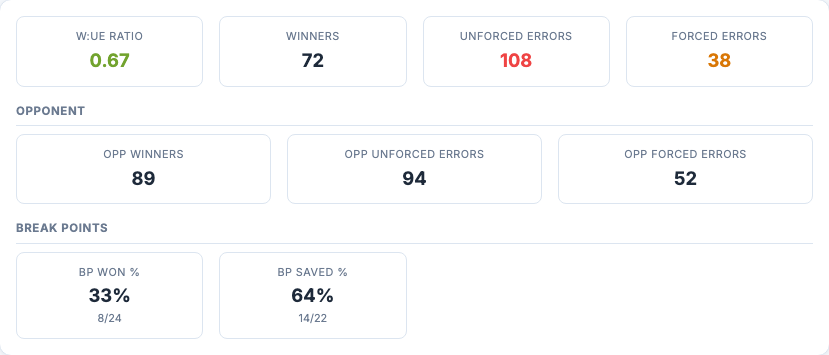
12-metric radar showing strengths and areas to develop vs benchmarks
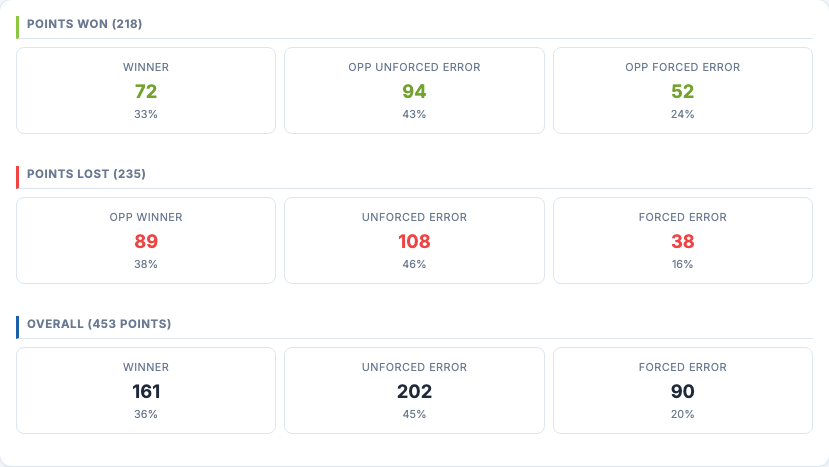
How points are won and lost by rally length, shot type, and court position
Stats tracked session to session so improvement is visible over time
Your portal is your private window into your tennis data. Every session we analyse is uploaded to your personal dashboard: videos, reports, charts, and stats, all in one place, accessible from any device.
When you log in, you land on your personal dashboard. It shows all the players linked to your account at a glance, with quick-access buttons to every section of each player's portal.
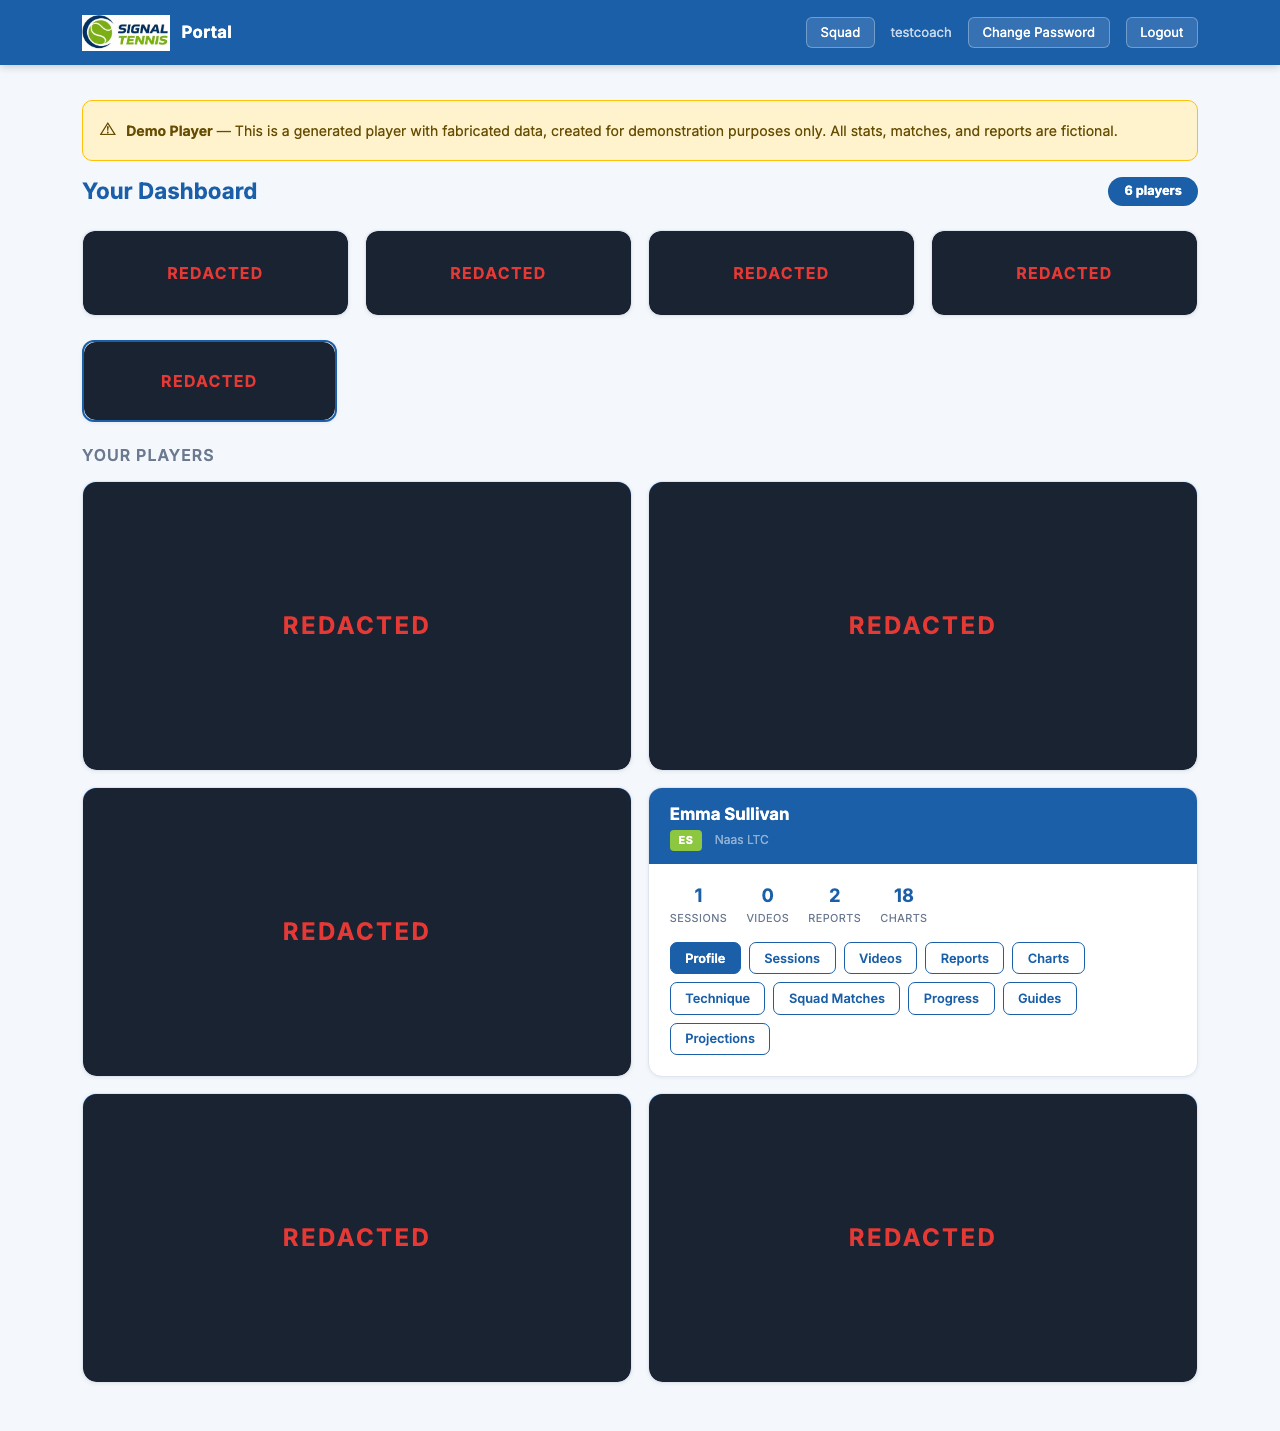
- Coaches see all their players; parents and players see their own profile
- Staff members get an additional Squad Analytics button for group-level data
The player profile is the central hub for each player. It combines identity, rankings, key metrics, and a full scouting report, all derived from match data we've tagged.
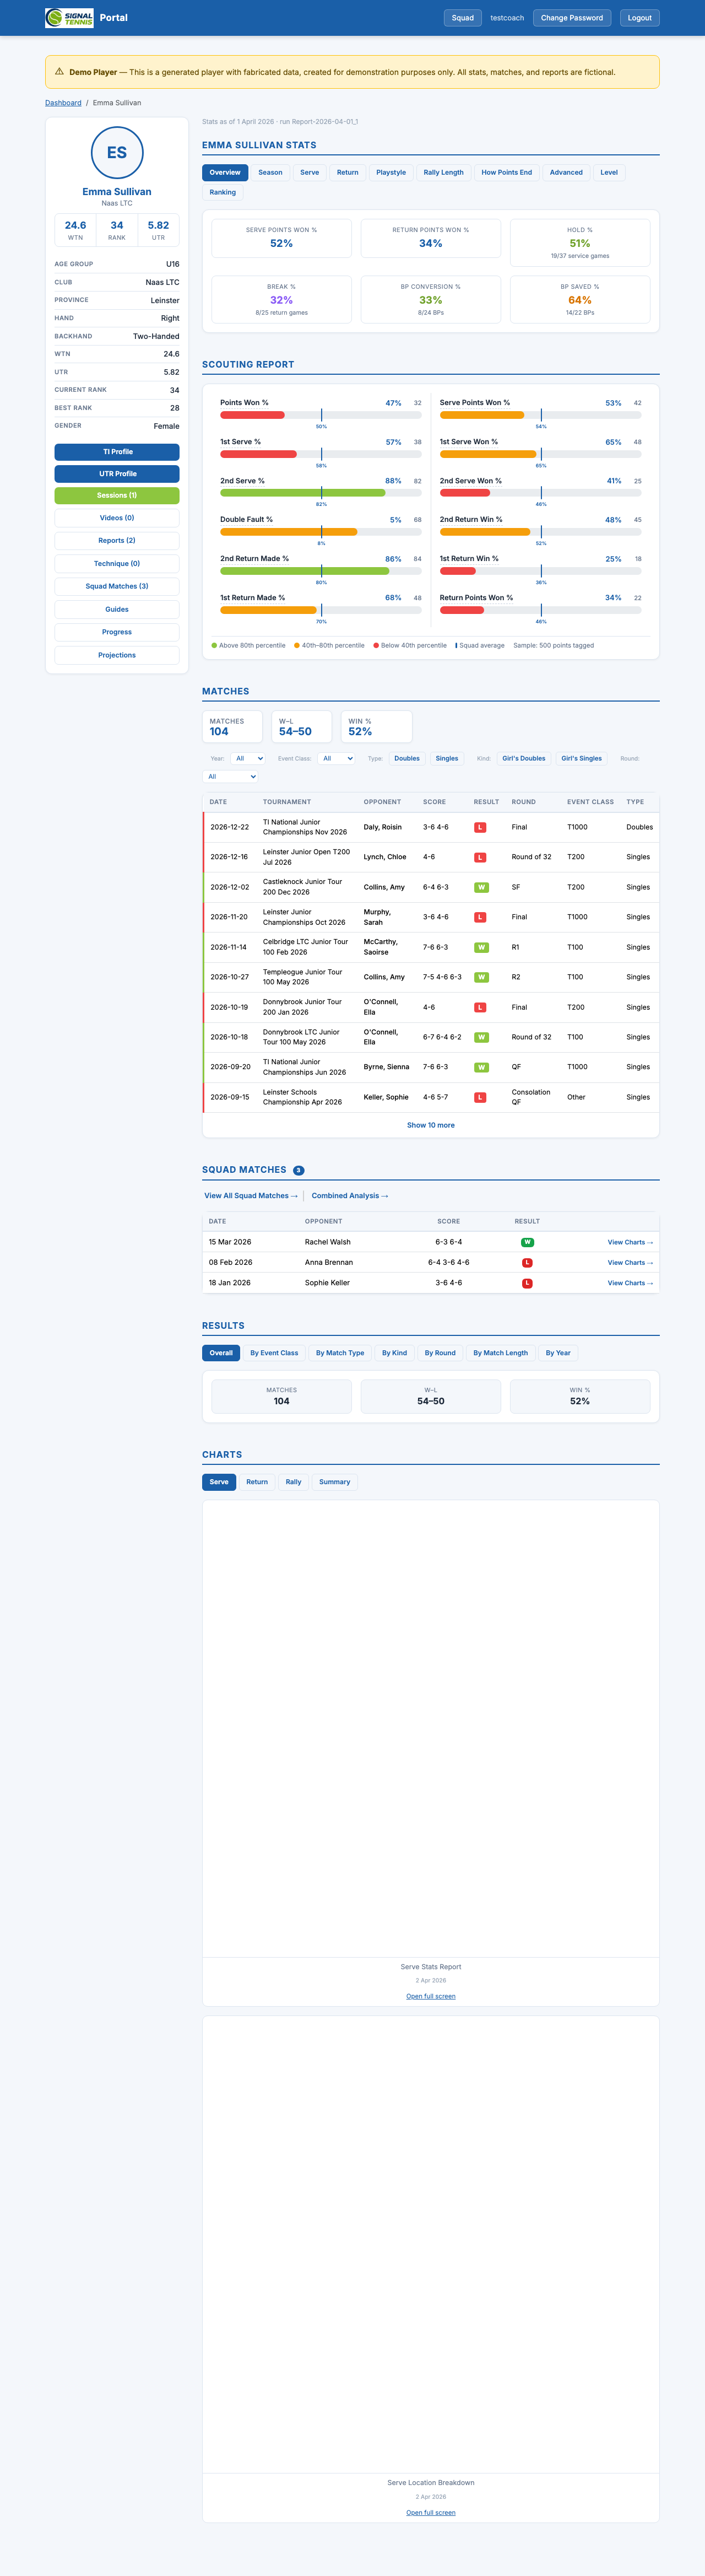
- Sidebar: Avatar, name, club, WTN / National Rank / UTR at a glance, plus full details (age group, hand, backhand, province, best rank, gender)
- Quick navigation: Buttons to every portal section with content counts
- Stats tabs: 10 tabs covering every area of the game (see below)
- Scouting Report: 12 radar metrics as colour-coded percentile bars
Stats: Deep Dive by Tab
The stats section is organised into 10 tabs, each covering a different aspect of the player's game. Click through to see what each tab reveals.
Scouting Report
The scouting report distils 12 key metrics into a visual at-a-glance summary. Each bar is colour-coded by percentile against the squad, instantly highlighting strengths and weaknesses.
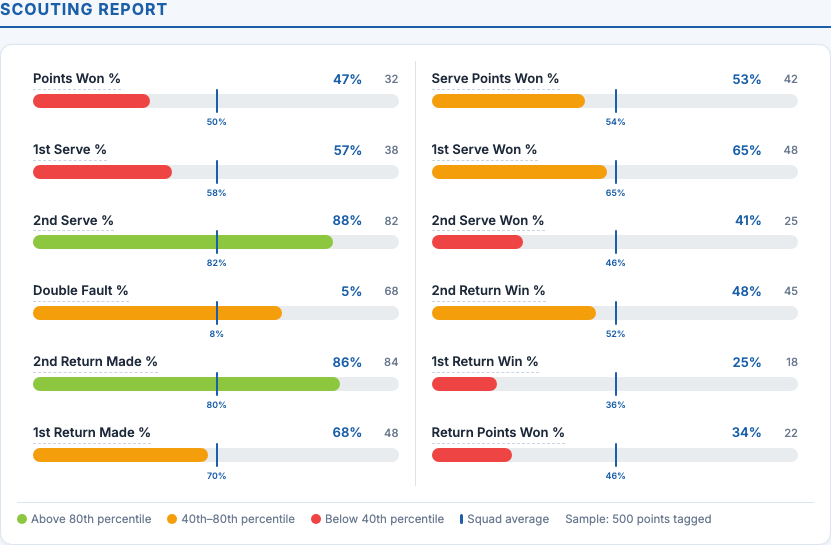
- Green = 80th percentile or above (strength)
- Amber = 40th–80th percentile (developing)
- Red = below 40th percentile (area to improve)
- Squad average marker on each bar for instant comparison
Matches
Every match we've tagged is recorded with full metadata: tournament, opponent, score, result, round, event class, and match type. Filter by year, event class, type, or kind to find exactly what you're looking for.
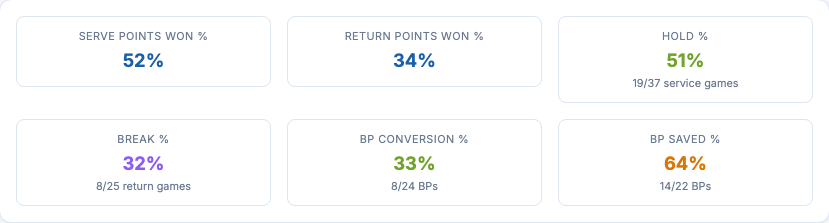
Results: Finding the Signal
Raw match data becomes actionable when you slice it the right way. The results section aggregates your record by every meaningful dimension, revealing patterns that aren't obvious from individual match scores.

This is where we find the signal.
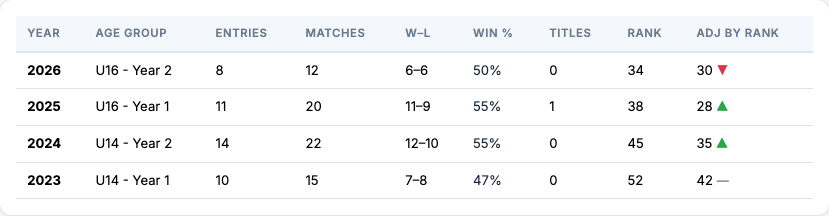
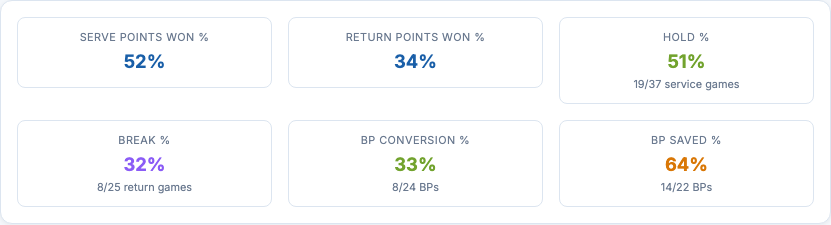
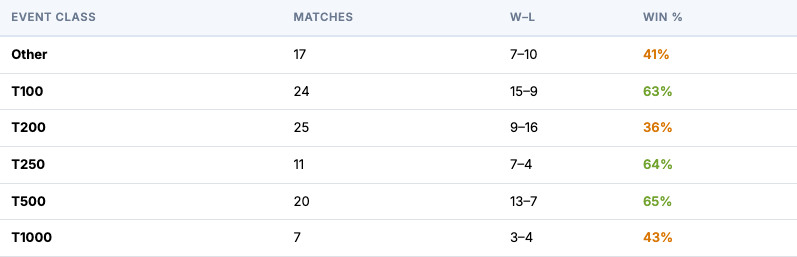
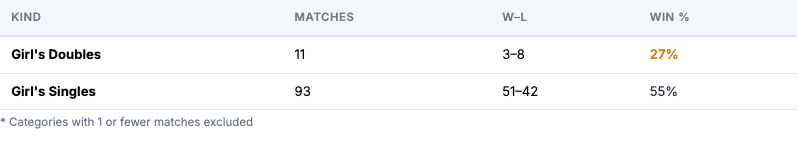
A 52% overall win rate (54-50) looks average. But break it down and patterns emerge:
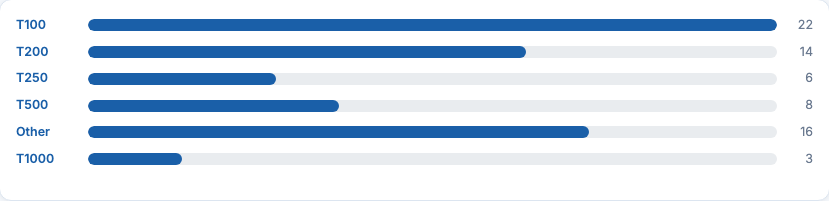
- Strong at T100 (63%) and T500 (65%), but dropping at T1000 (43%). That gap suggests a confidence, technical or tactical issue against certain opposition styles.
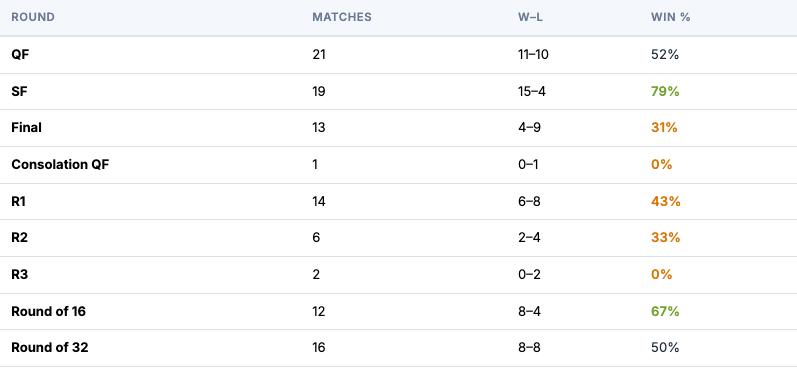
- 79% in semi-finals but only 31% in finals. Consistently getting deep but struggling to close out tournaments.
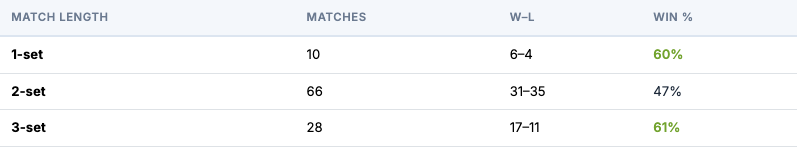
- Three-set record: 61% vs 47% in straight sets. Performs better in longer matches, which points to resilience but also slow starts.
- R1 win rate just 43%. Early-round losses are a pattern worth investigating.
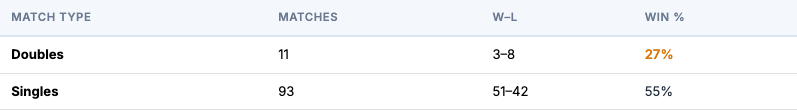
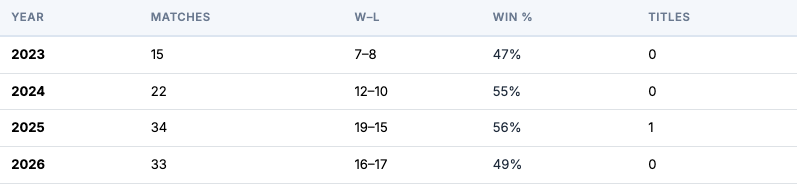
The results section breaks down by Event Class, Match Type, Kind, Round, Match Length, and Year, so you can pinpoint exactly where to focus your training.
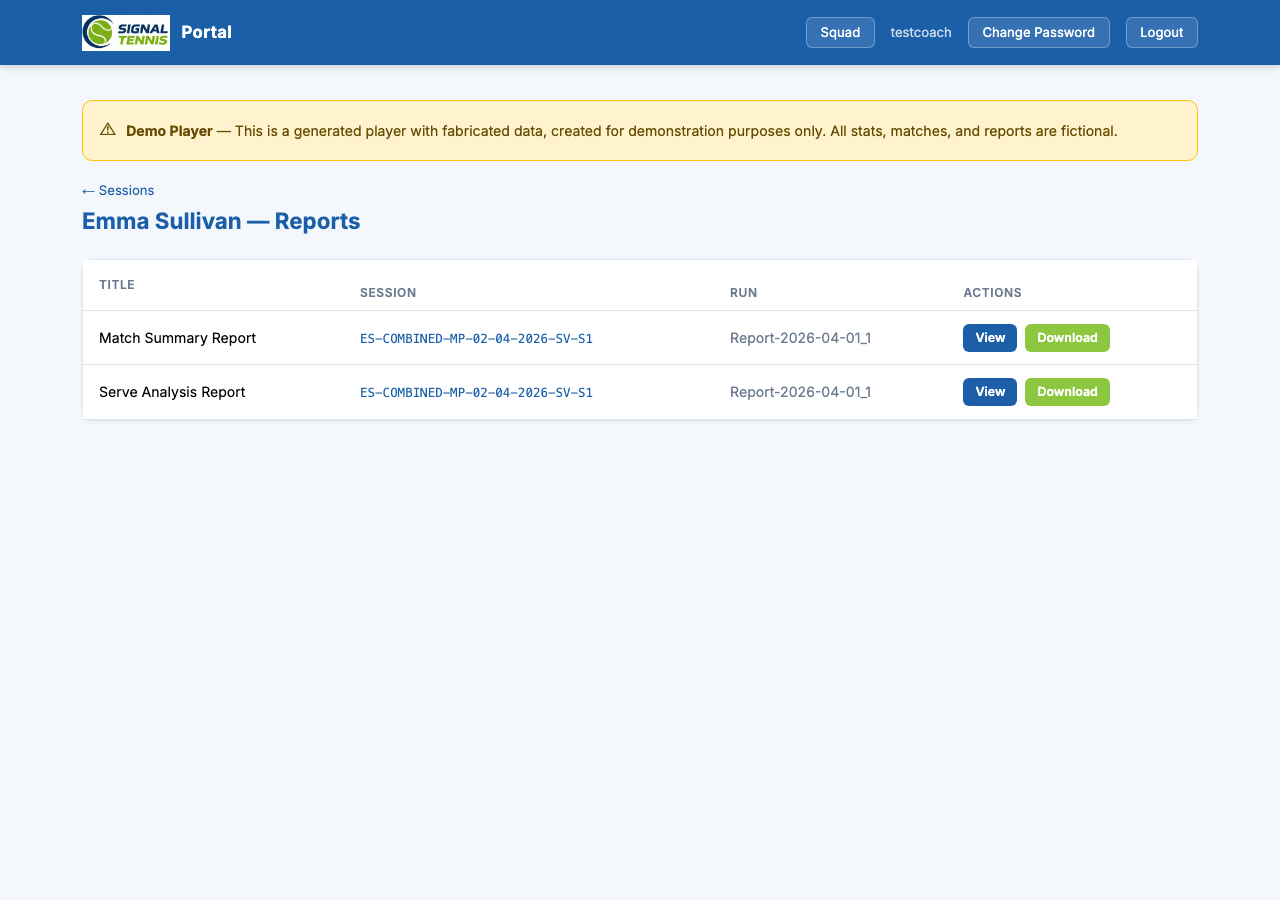
Sessions
Every match or training session we analyse becomes a session in your portal. Sessions are the organising unit: all videos, reports, and charts for a match live together under one session.
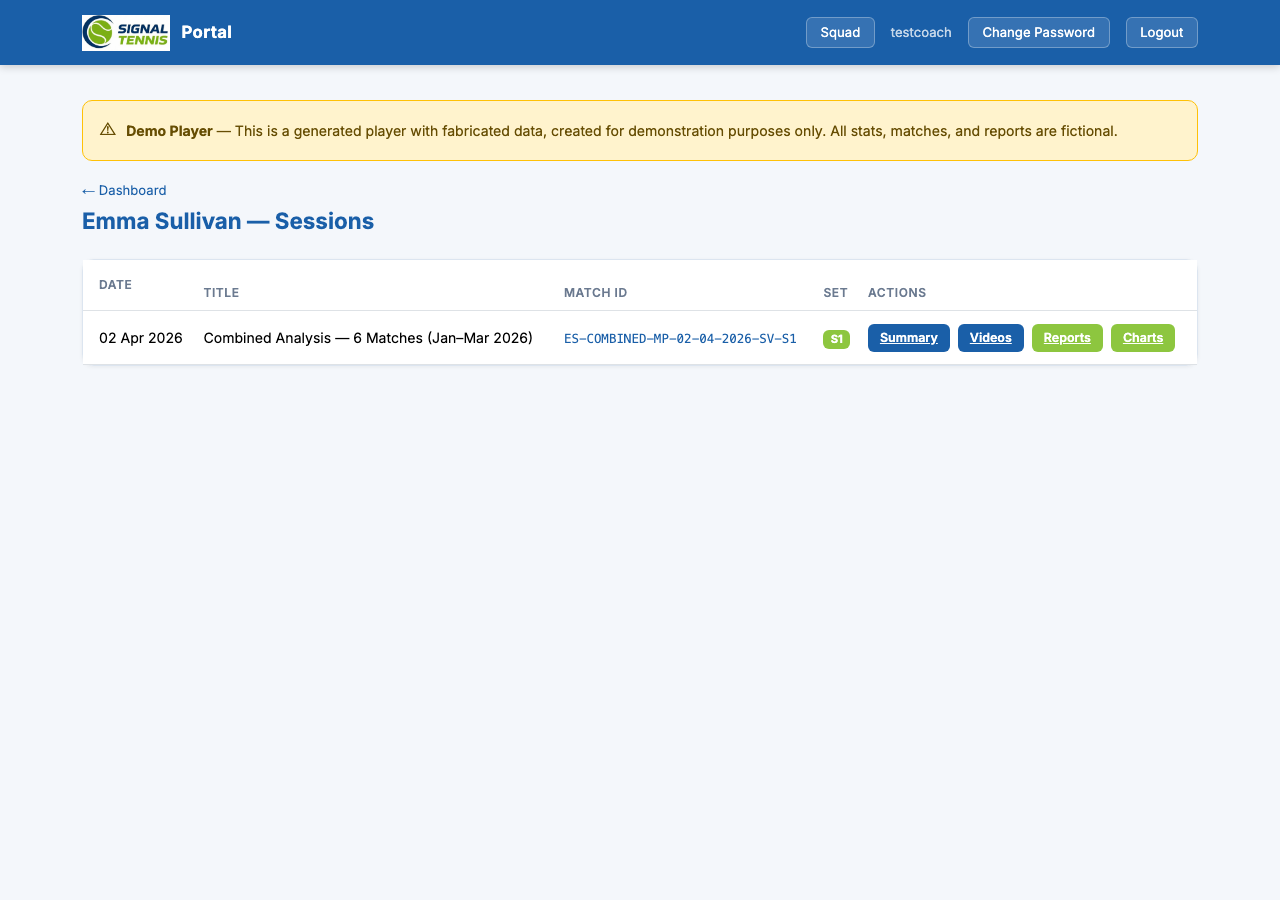
- Reports: Downloadable PDFs (match summary, serve analysis)
- Charts: Interactive analysis charts you can hover, zoom, and explore
- Videos: Match highlights and tactical clips (when available)
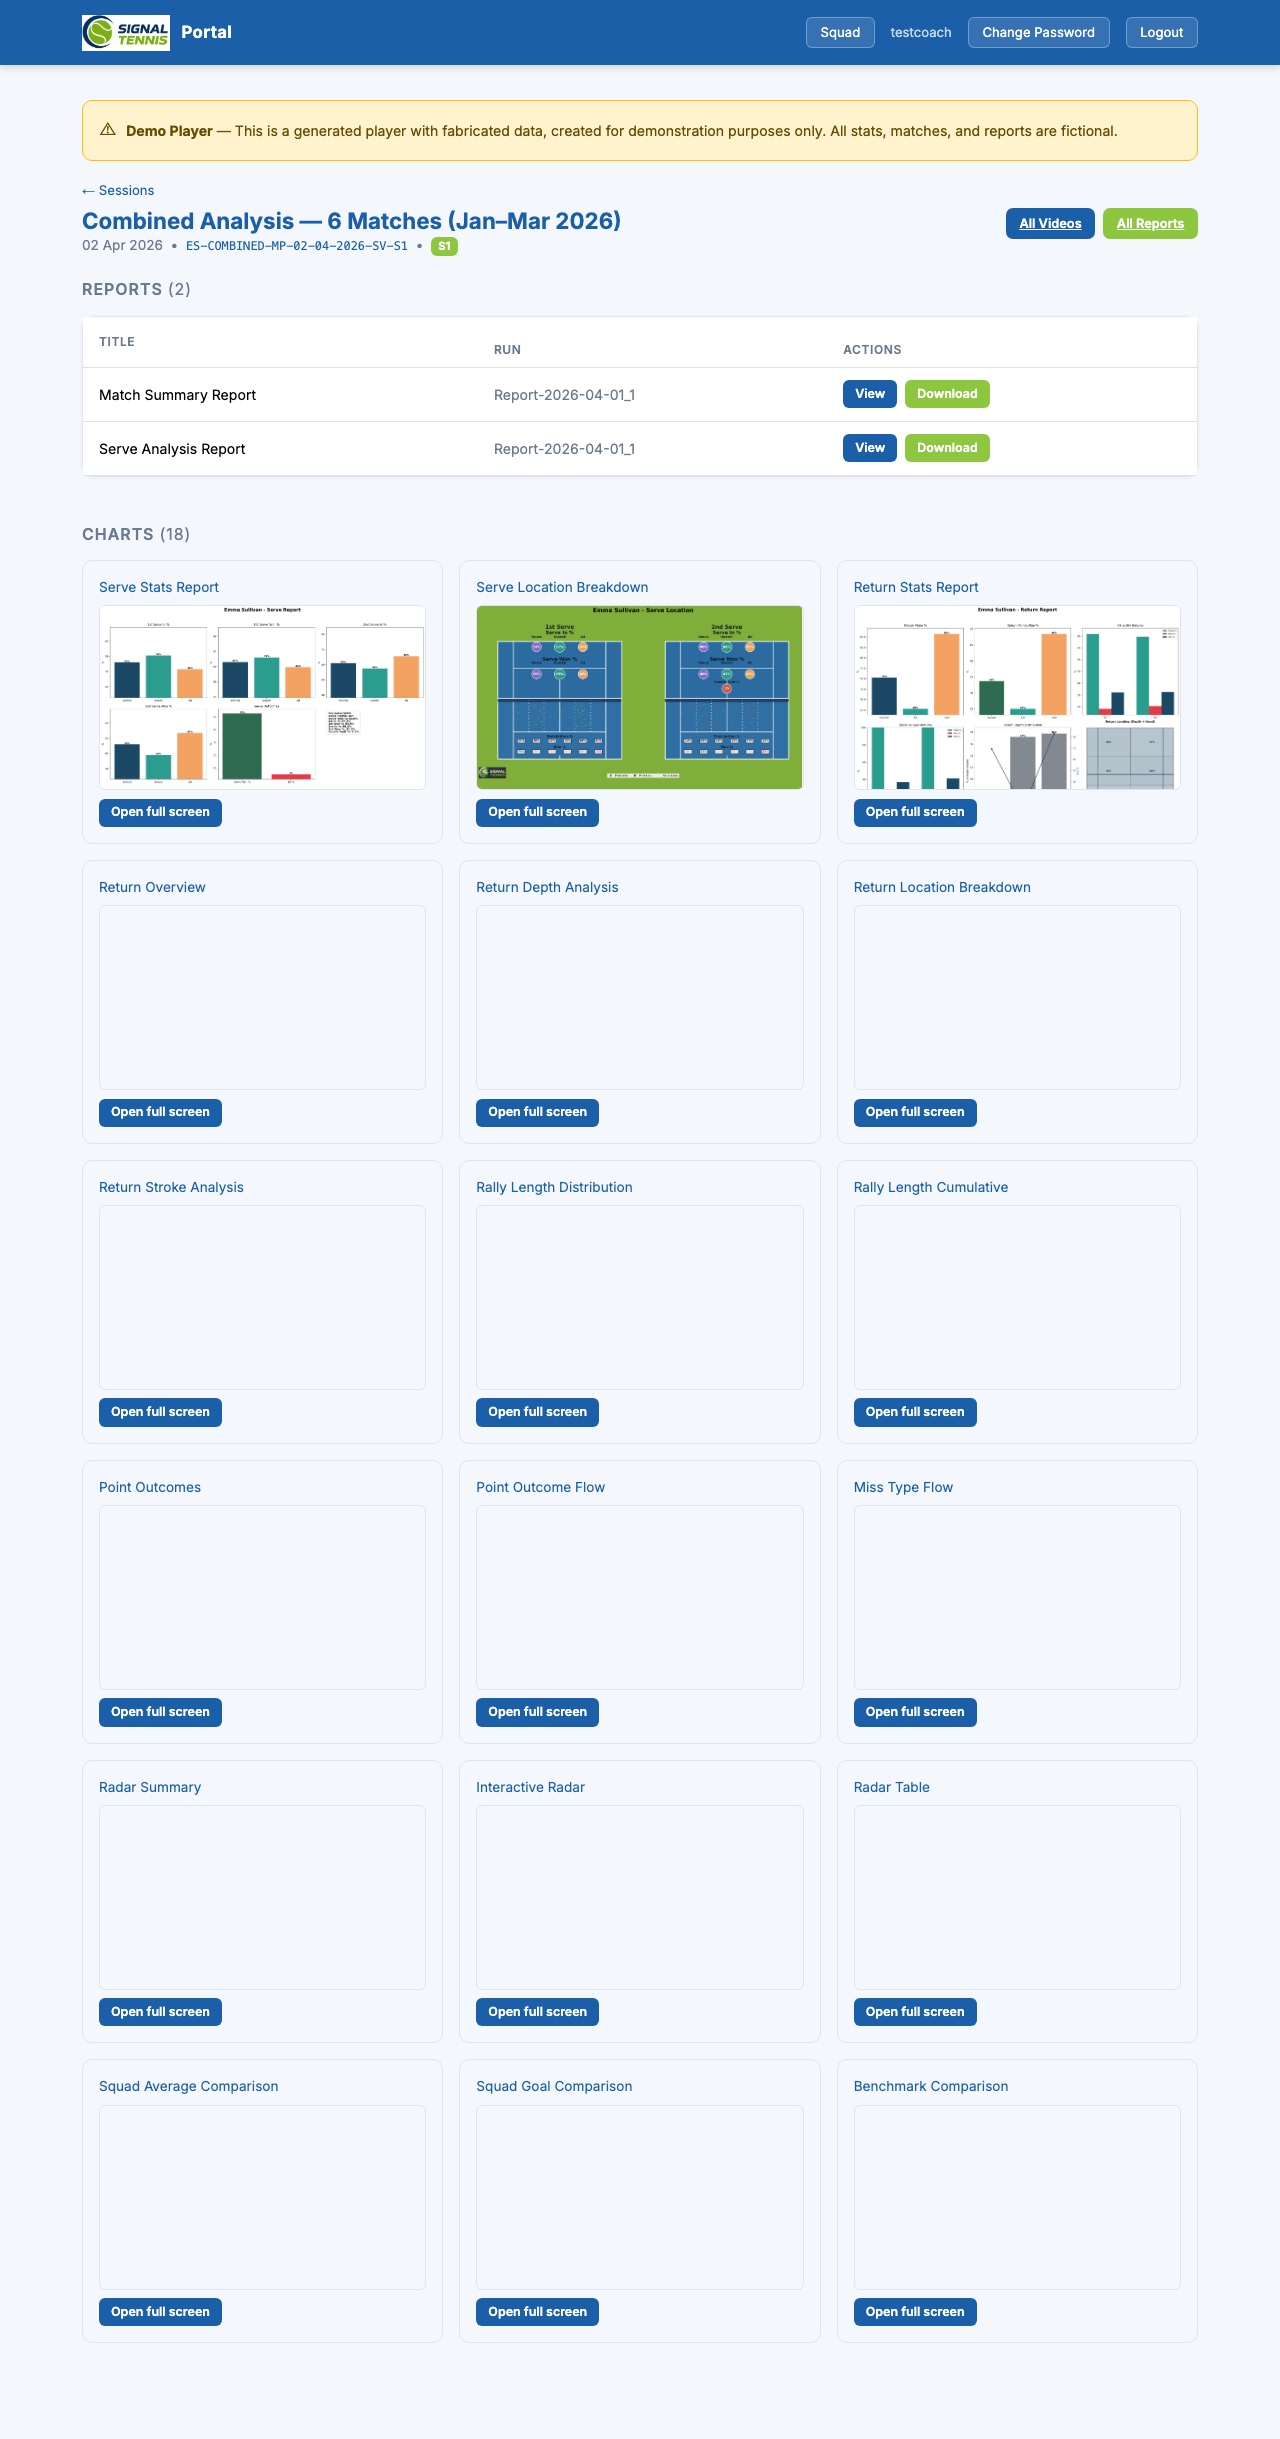
Interactive Charts
Charts are generated by our analysis pipeline from your tagged match data. Each chart type shows a different aspect of your game, aggregated across all analysed sessions for a complete picture.
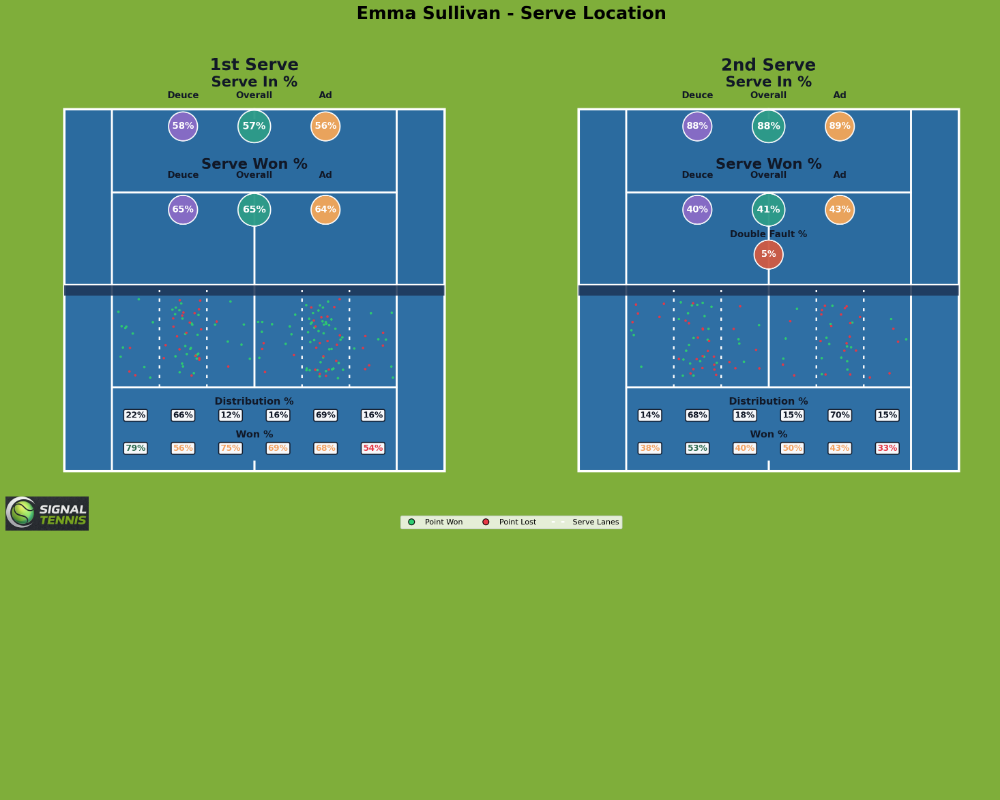
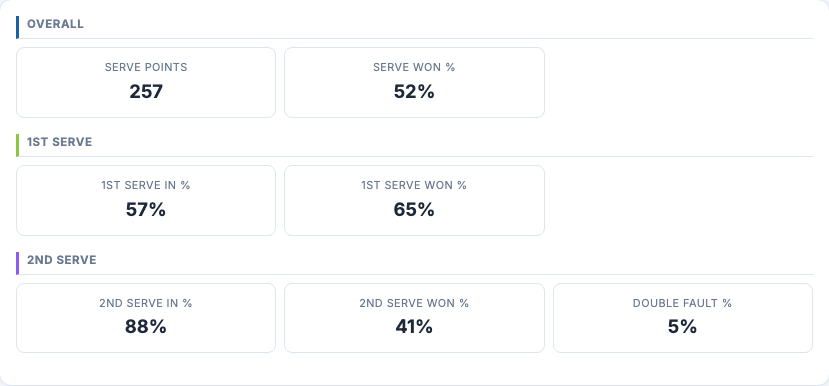
- Serve: Location breakdown with placement patterns, win rates by zone, and court-side splits
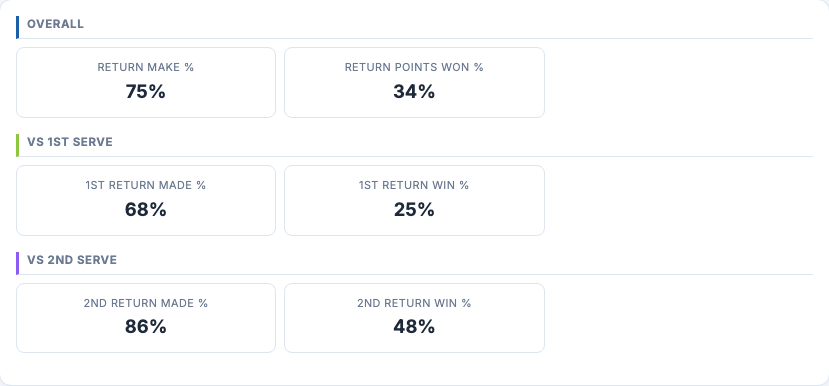
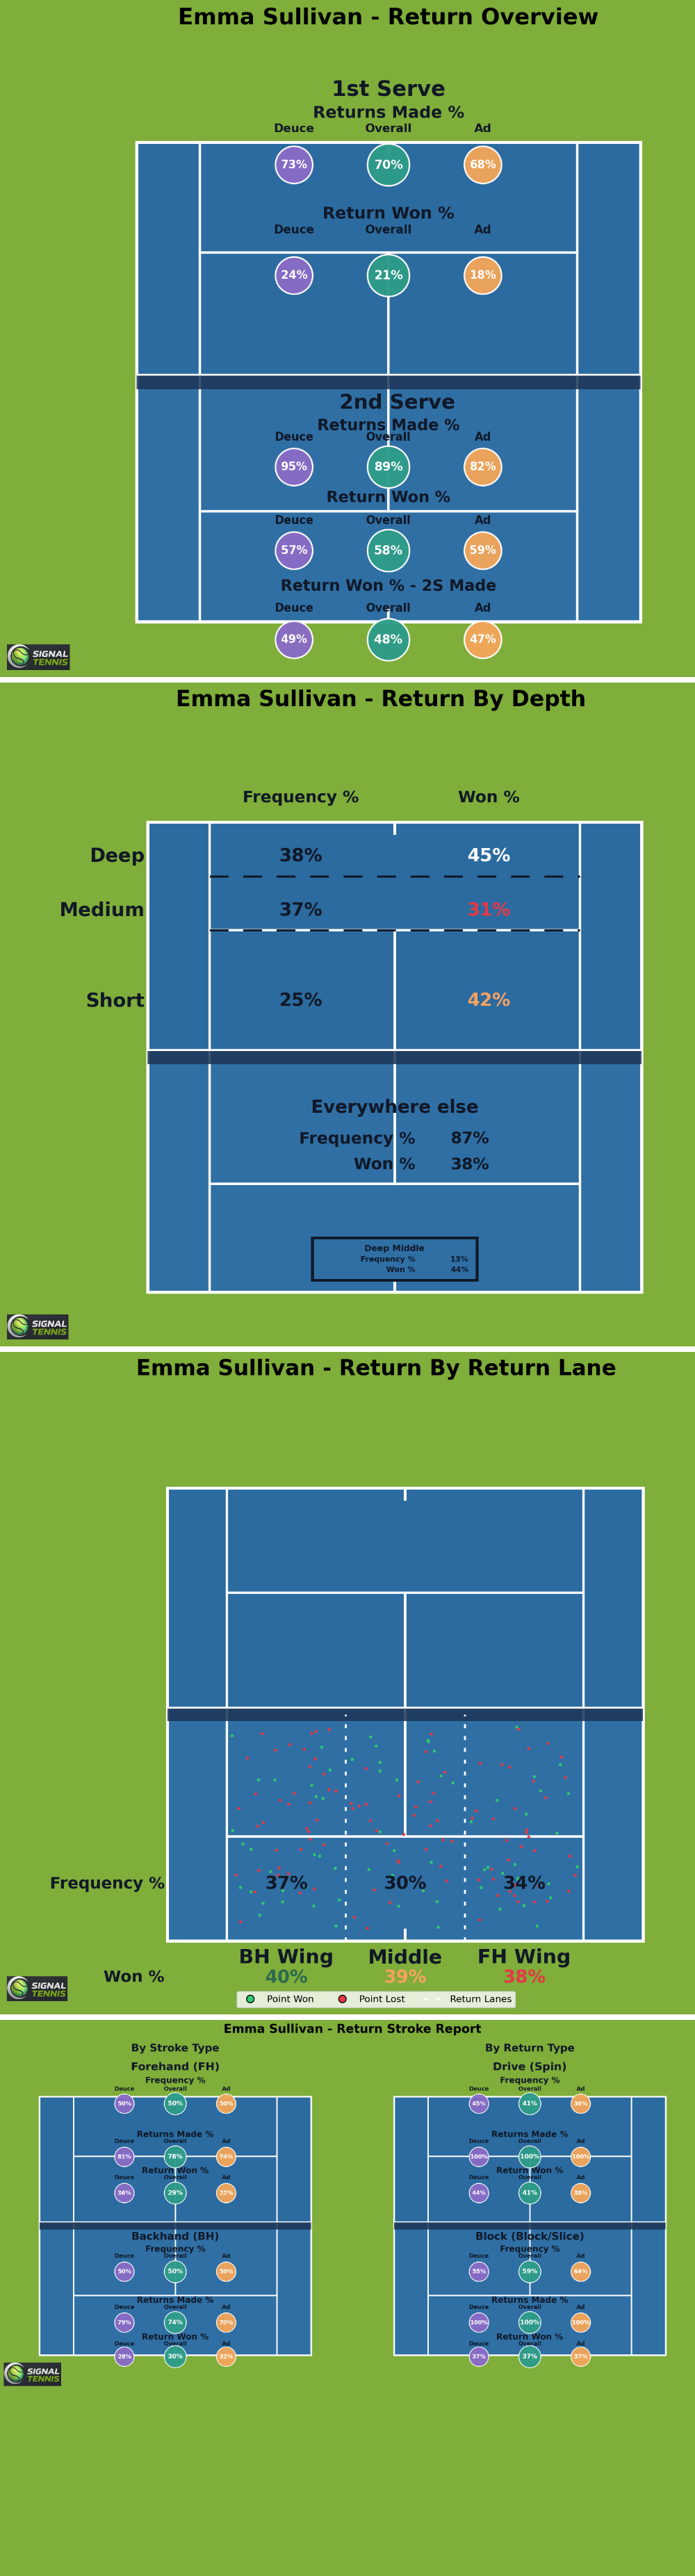
- Return: Overview, depth analysis, location breakdown, and stroke analysis
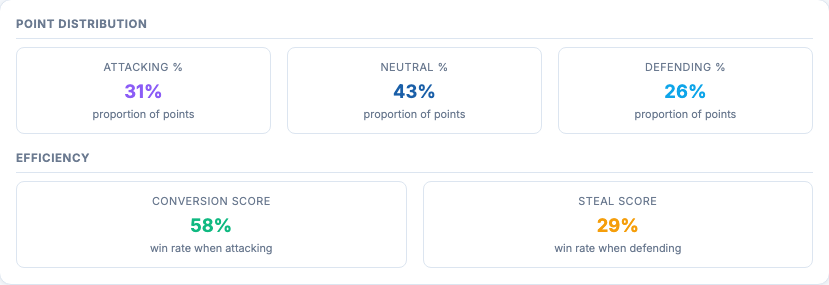
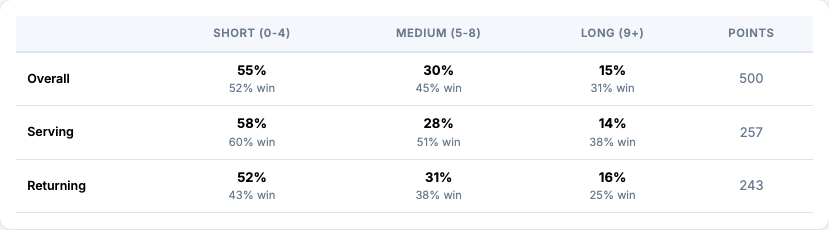
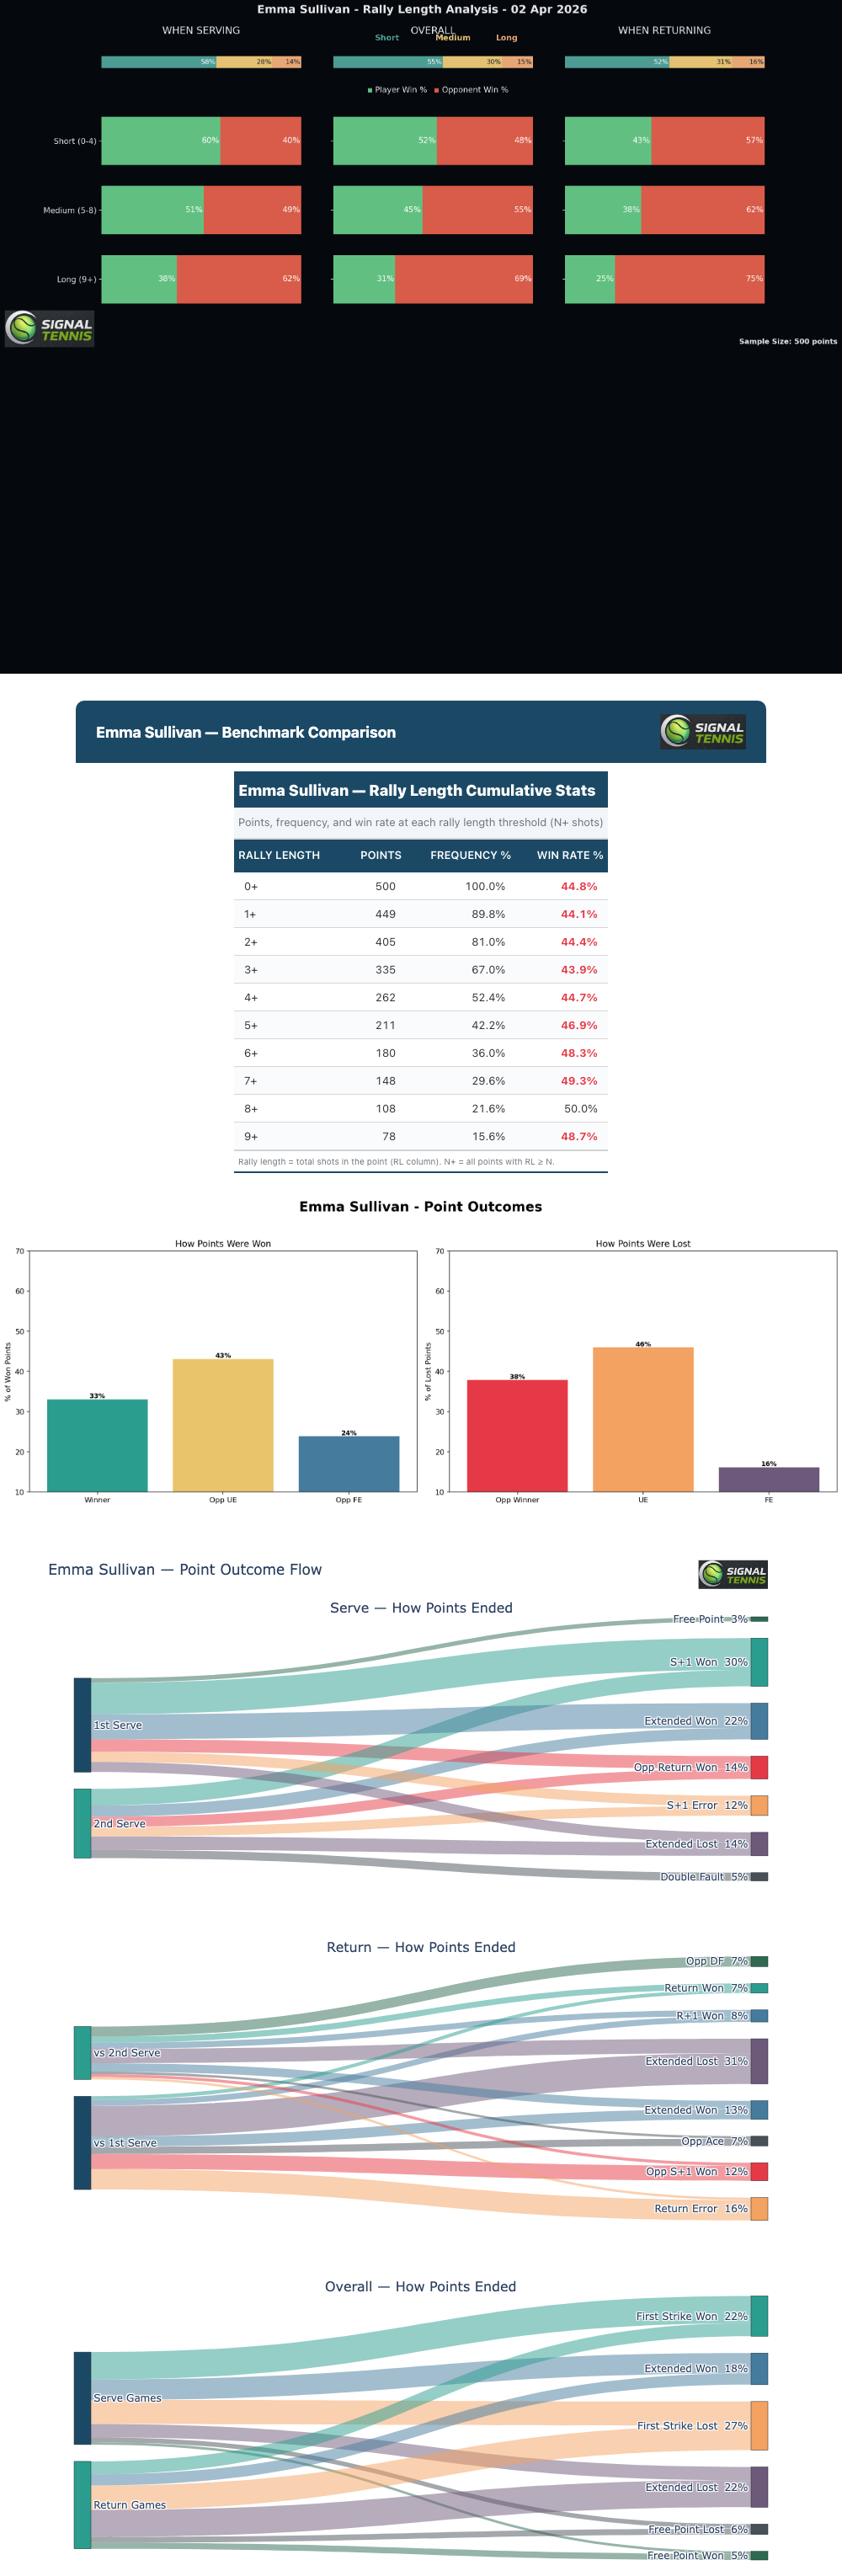
- Rally: Length distribution, cumulative win rates, point outcomes, and outcome flow (Sankey)
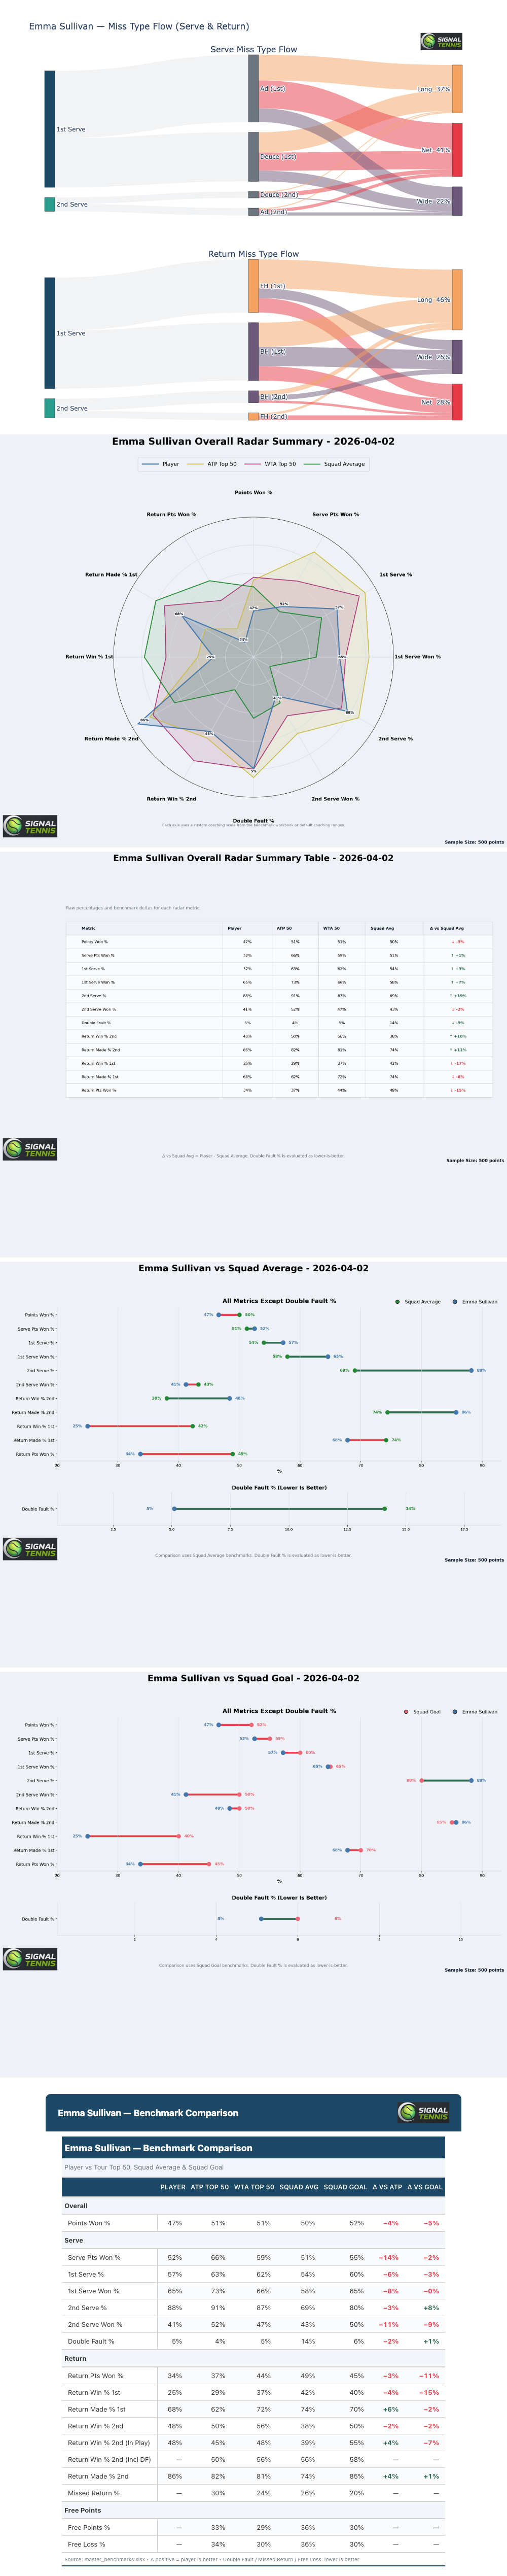
- Summary: Radar charts, miss type flow, squad comparisons (dumbbell), and benchmarks
Every chart is interactive: hover for details, zoom, and open full-screen.
PDF Reports
Every session can include downloadable PDF reports: detailed match summaries and specialist analysis documents you can save, print, or share with your coach.
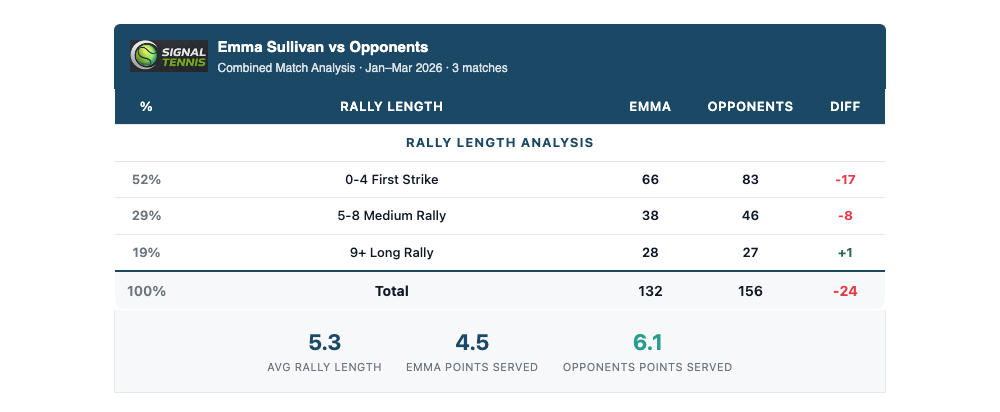
Squad Match Charts
Match charts show head-to-head analysis for individual matches, plus a combined view that aggregates patterns across all your analysed matches.
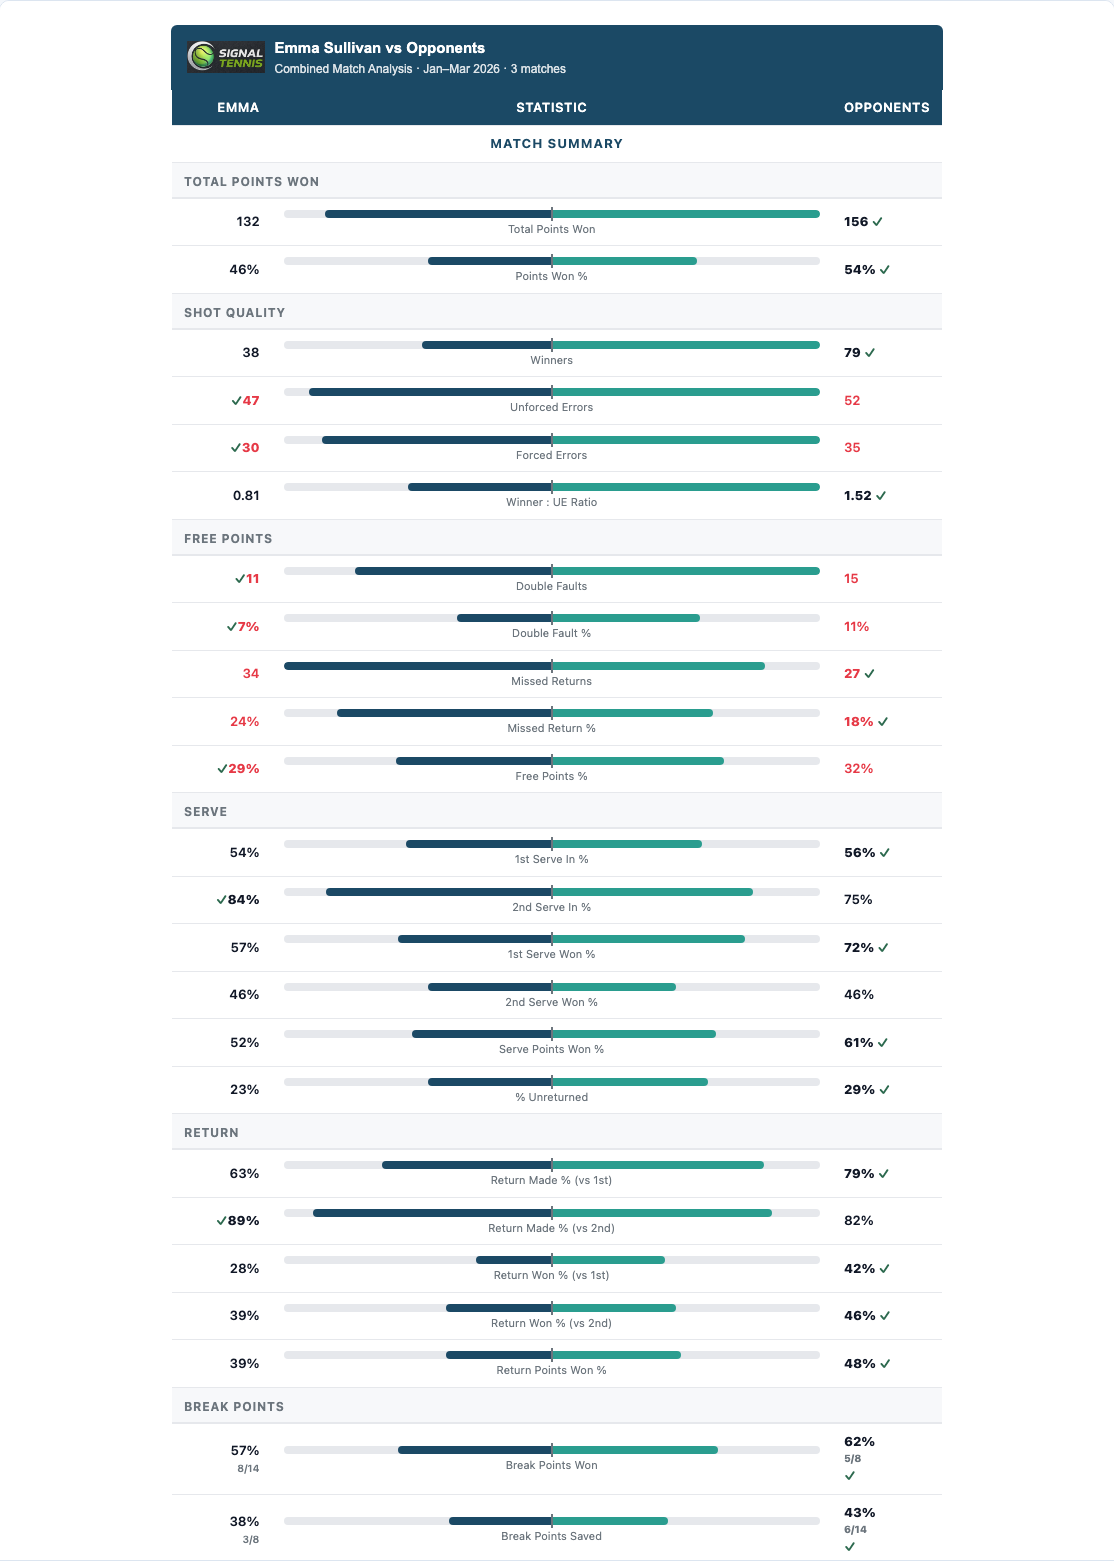
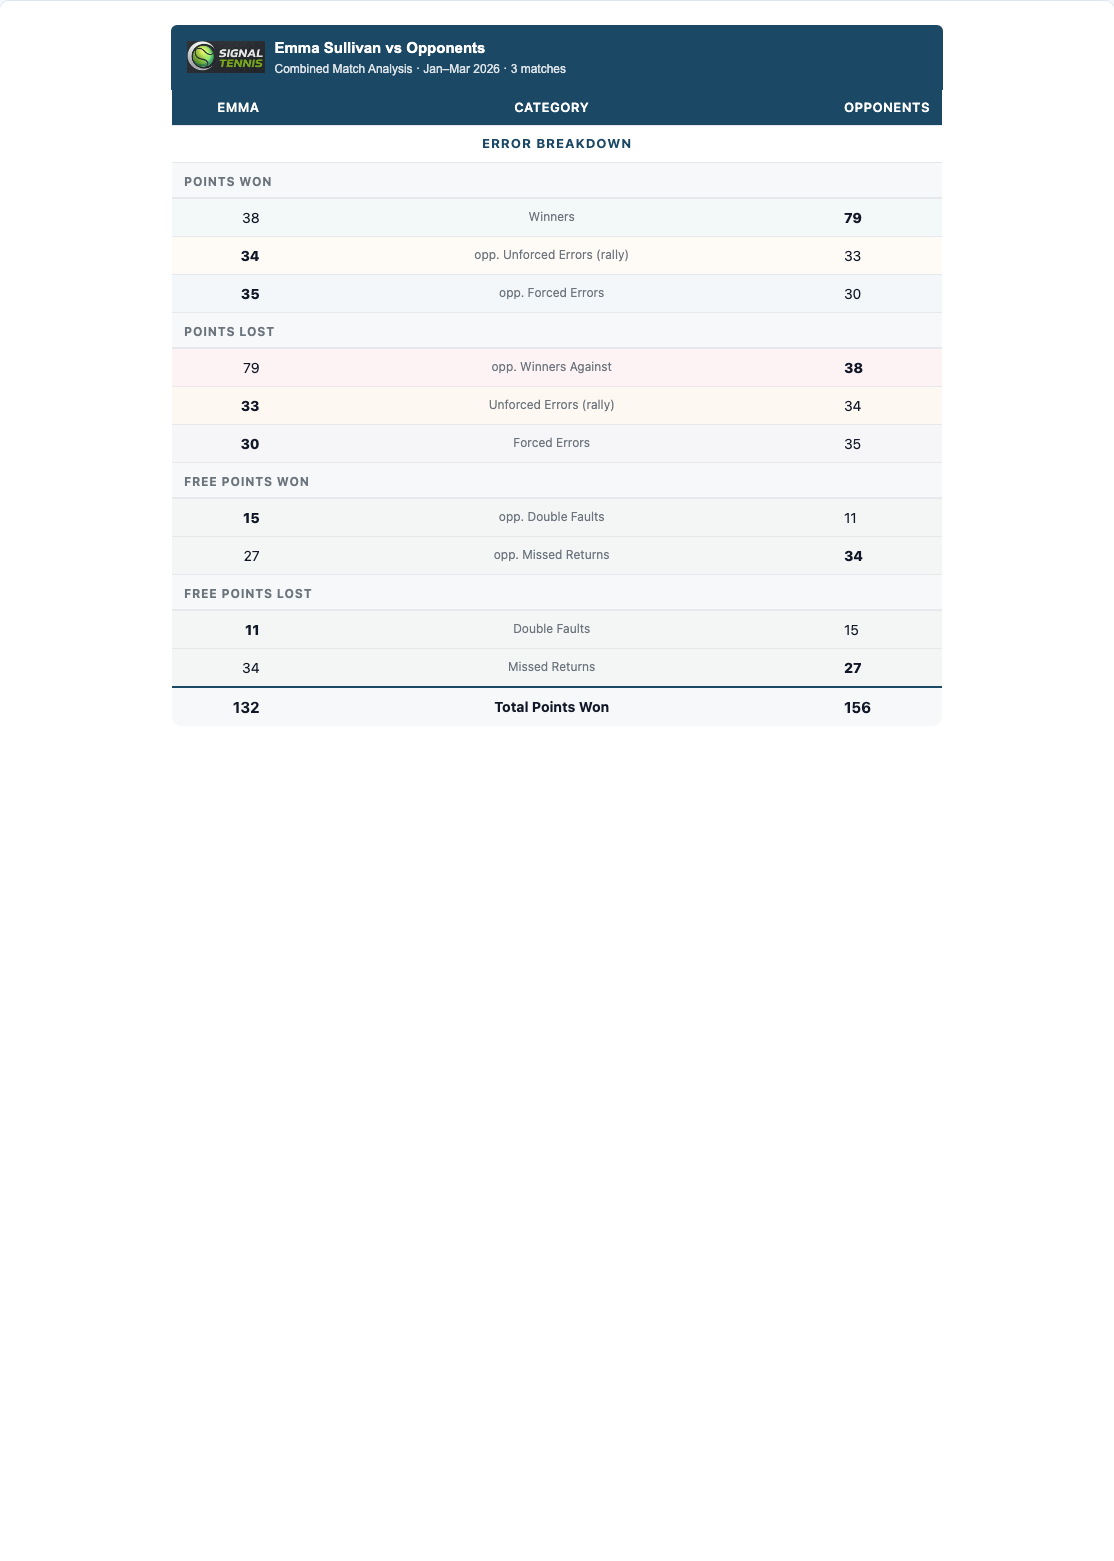
- Combined Match Summary: Win-loss record, total points, per-match breakdown table
- Error Breakdown: Where errors come from (forehand UE, backhand UE, double faults, net errors)
- Rally Length Analysis: Win rate by rally category with colour-coded trend tags
- Toggle between Combined (aggregate) and Individual match views
Video Library
Match highlights and tactical clips, streamed directly in your browser, organised by category (Serve, Return, General, Tactical, Technical). Each clip plays in an embedded HD player with full playback controls.
Technique Analysis
Stroke-by-stroke breakdown with slow-motion footage, match clips, practice footage, and frame-by-frame image sequences. Organised by stroke category (Forehand, Backhand, Serve, Return, Net Play, Slice, etc.).
Progress Tracking
The Progress page tracks your development over time with interactive visualisations built from your match data and ranking history.
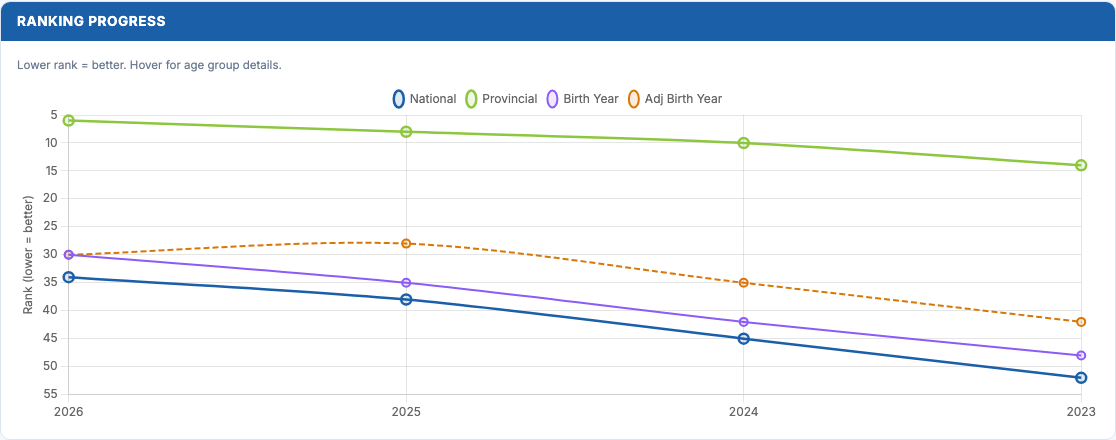
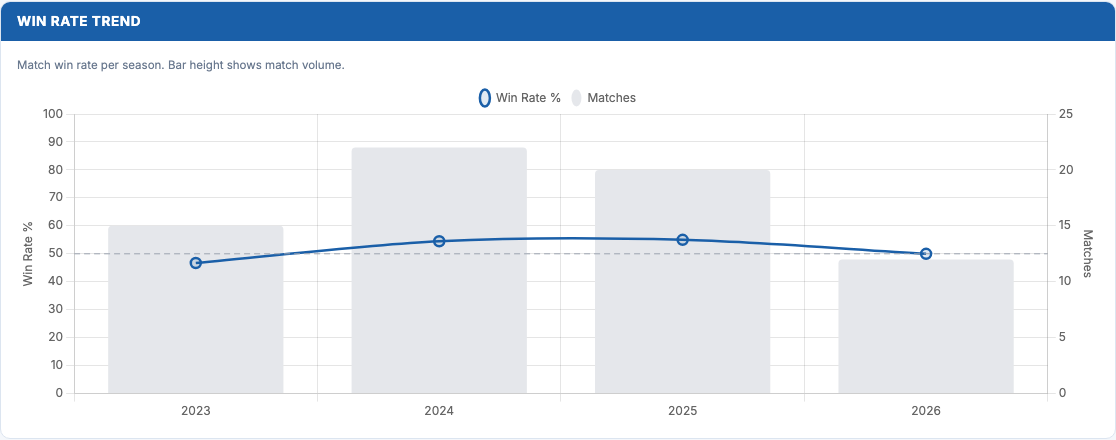
- WTN & Ranking Points: Dual-axis line chart showing improvement over time
- Win Rate Trend: Match volume bars with win rate percentage line
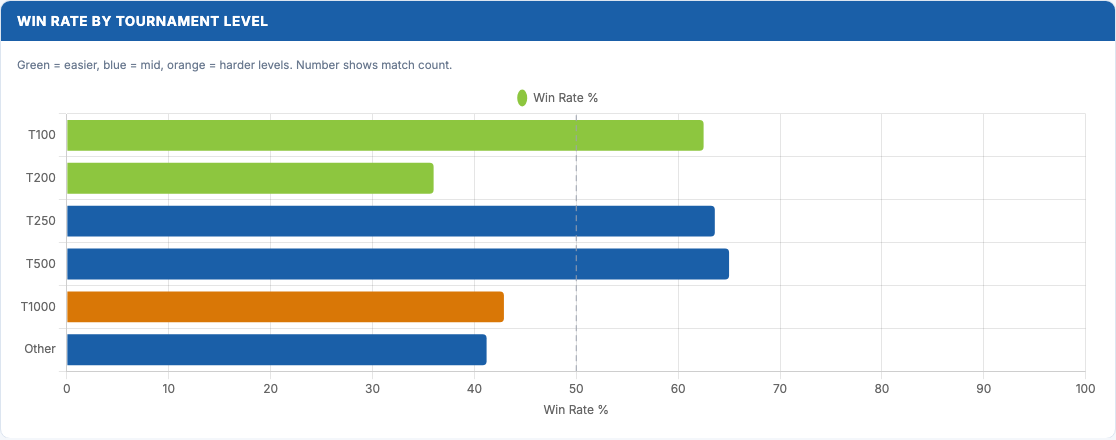
- Win Rate by Tournament Level: Horizontal bars colour-coded by difficulty
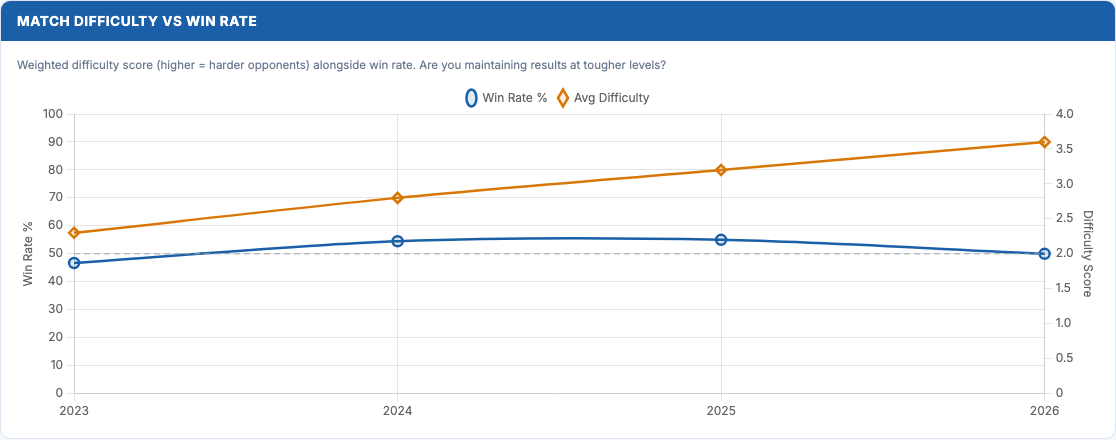
- Match Difficulty vs Win Rate: Does win rate hold against tougher opponents?
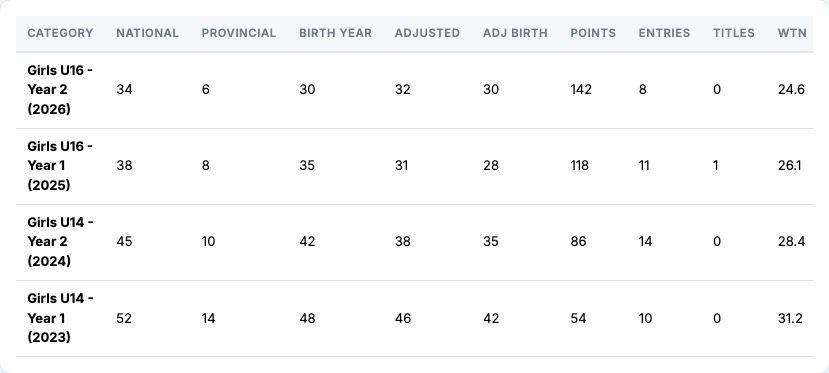
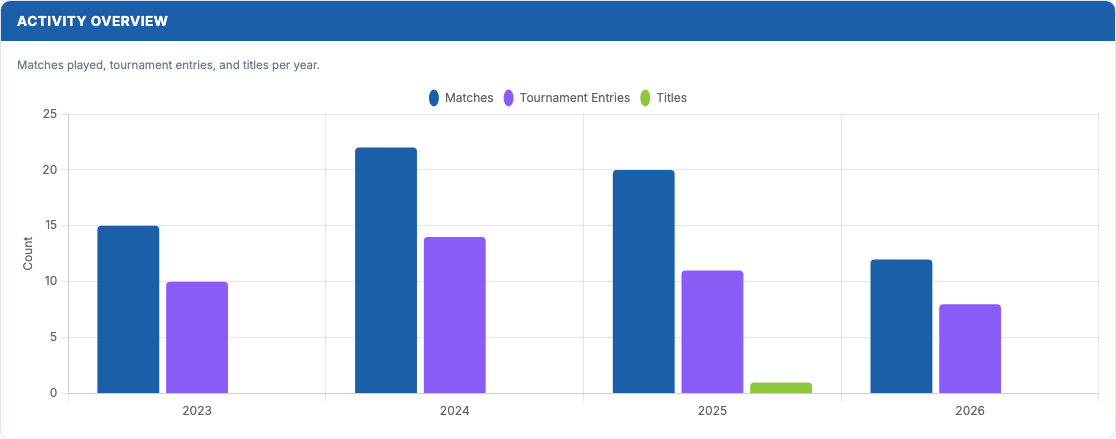
- Activity Overview: Matches, entries, and titles per year
Projections
The Projections page is where data meets action. Interactive tools let you model "what-if" scenarios and see exactly how specific improvements would change your results.
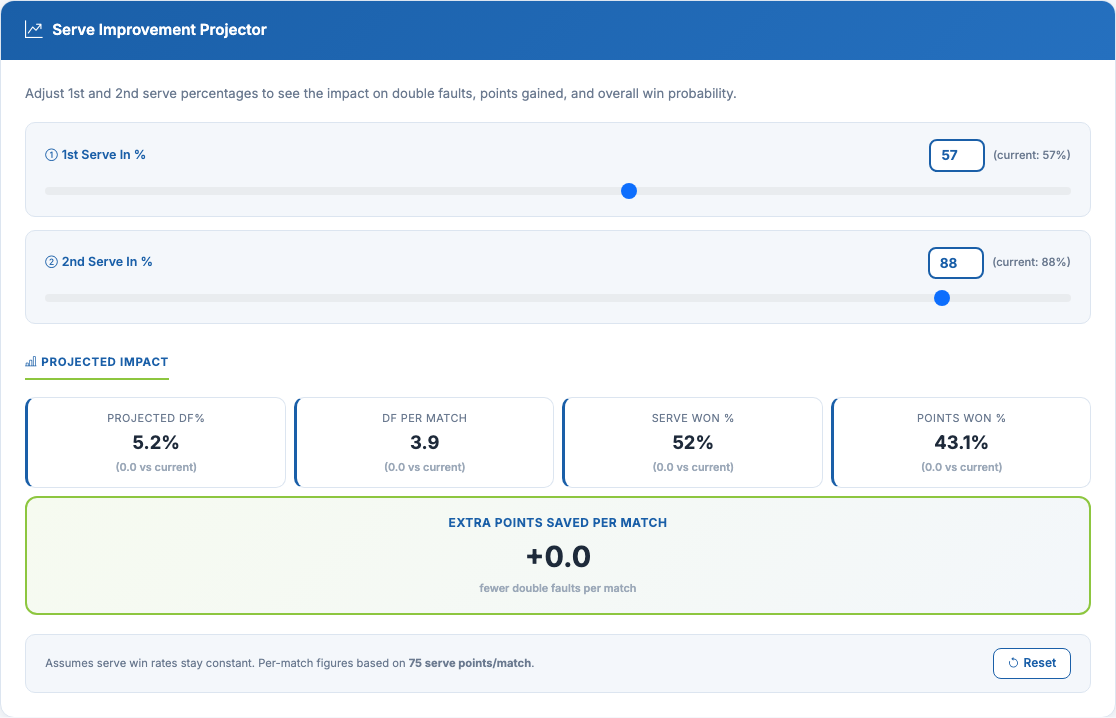
- Serve Improvement Projector: Adjust 1st/2nd serve percentages to see projected impact on double faults, serve points won, and overall points
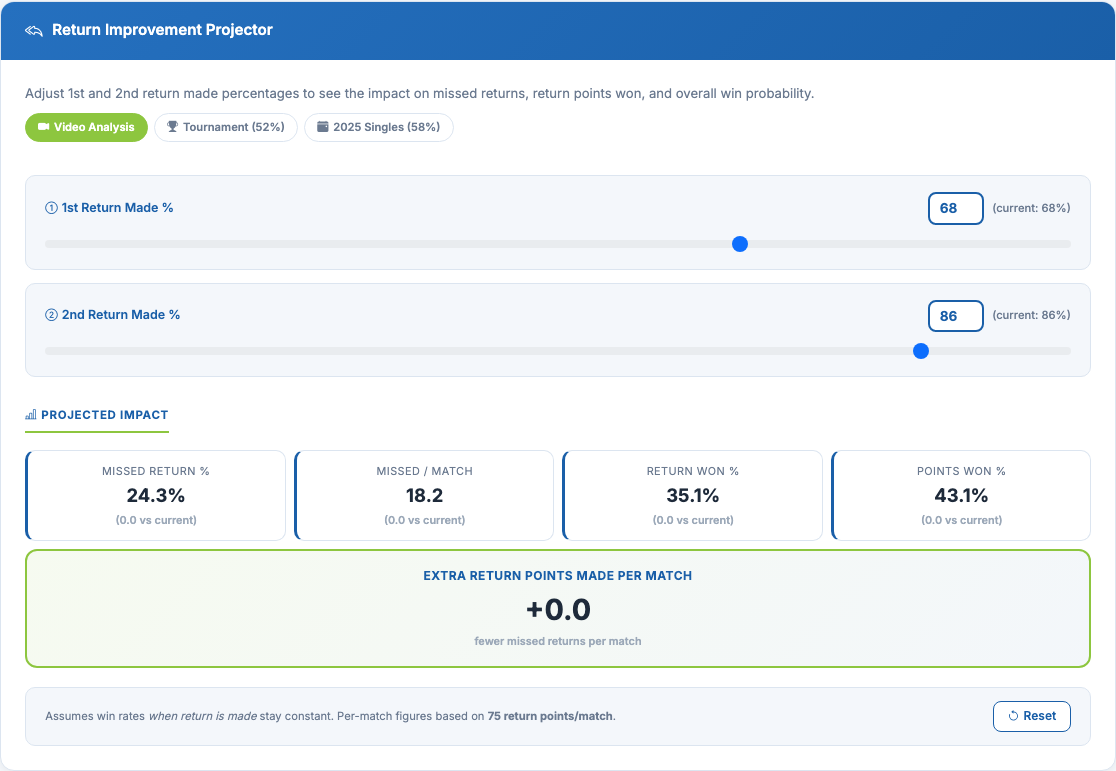
- Return Improvement Projector: See how fewer missed returns translate to more return points and overall points won
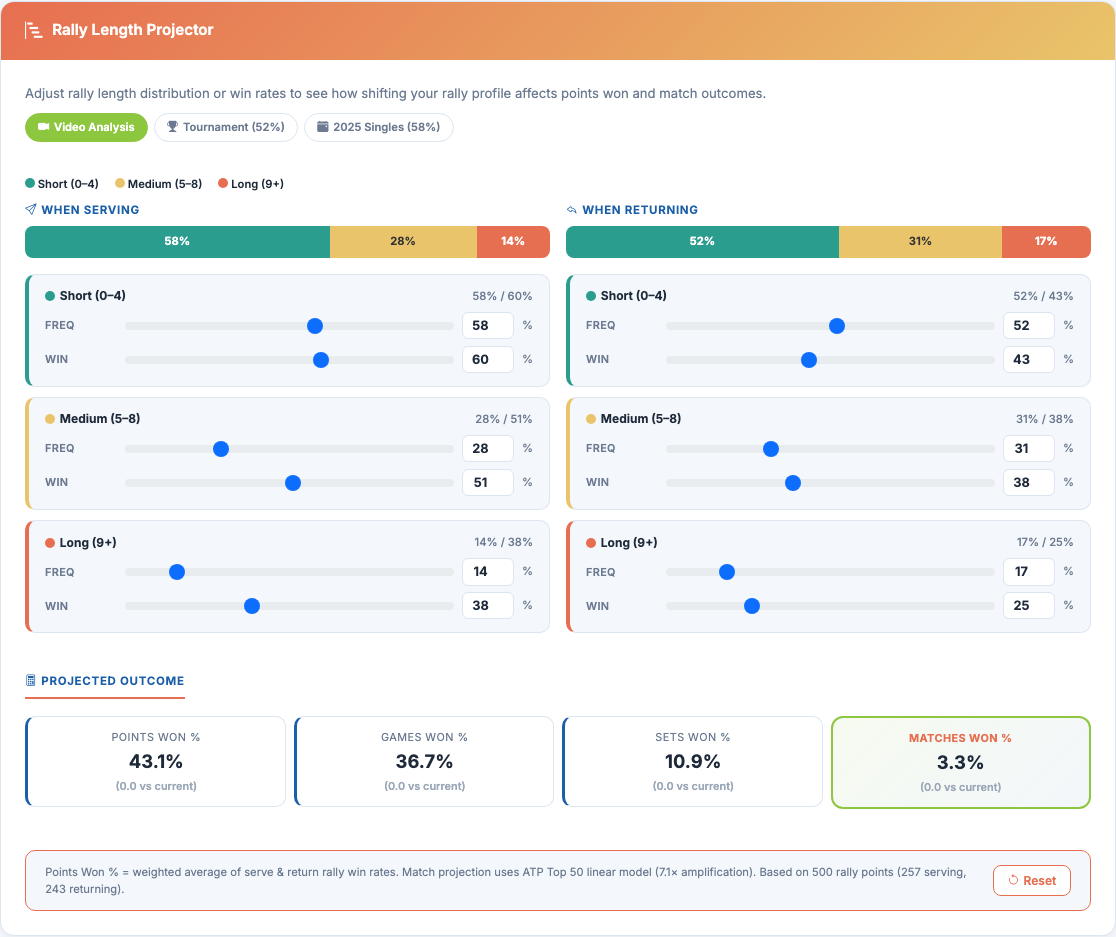
- Rally Length Projector: Model what happens if you extend or shorten rallies
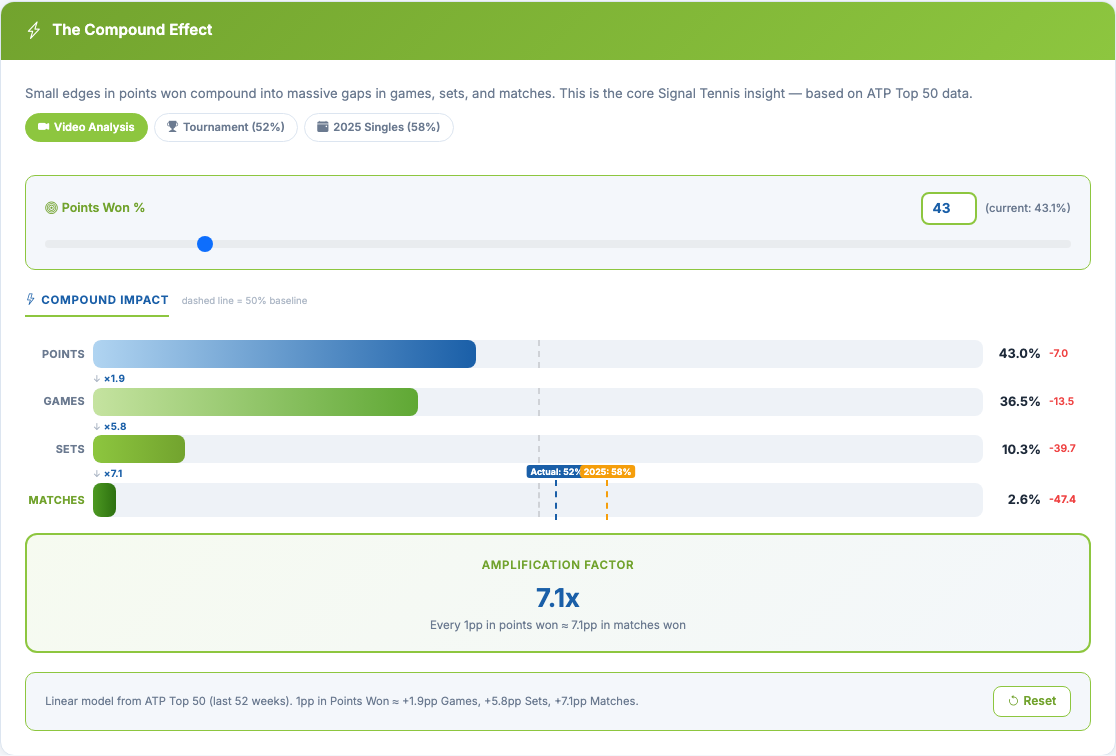
- The Compound Effect: How small edges in points won compound into significant gaps in games, sets, and matches
Security & Privacy
Your data is yours. We take privacy seriously at every level of the portal.
Private Accounts
Every user gets a personal login. You only see the players linked to your account.
Time-Limited Links
Reports and charts are served via secure links that expire after 1 hour.
Streamed Video
Videos stream directly in your browser. Never downloaded to your device.
Encrypted Storage
All files stored with enterprise-grade encryption on Cloudflare R2.
How It Works
Session
We film and tag your match or training session
Processing
Our pipeline analyses every point, generates charts and reports
Portal
Everything is uploaded to your personal portal
Access
Log in from any device to explore your data